
Construction drawings are the authoritative source for every net, in-place quantity a quantity surveyor or civil engineer needs to measure. Before any waste factor, pricing rate, or productivity allowance enters the picture, the drawing set defines what exists: lengths of walls, areas of finishes, volumes of concrete, counts of fixtures. That sequence is non-negotiable. Measurement comes first, and drawings are where it starts. Under NRM2 and its predecessor SMM7, quantities are measured net as fixed in position, with adjustments applied separately. Professional judgement sits at the heart of that process: drawings show what is designed, not always what is buildable, and the surveyor's reading of the full set is what turns lines into defensible quantities.
Table of Contents
- Why drawings are the authoritative source for quantity measurement
- Which drawing types supply what to your takeoff
- UK measurement standards and drawing conventions that affect quantities
- How to extract quantities from drawings: a step-by-step workflow
- Common drawing interpretation errors and how to avoid them
- How digital tools and BIM change the role of drawings in takeoff
- How measured quantities convert to cost
- Practical checklist for every drawing-based takeoff
- How to verify and validate quantities before finalising measurement
- Interpreting complex drawing elements: irregular shapes and composite assemblies
- Coordinating measurements across drawing types to prevent double counting
- How drawing revisions are tracked and integrated into ongoing measurement
- Drawing tolerances and their impact on quantity measurement accuracy
- Key takeaways
- Why professional judgement still defines the quality of a takeoff
- Quantiflow brings NRM2-aligned automation to UK takeoffs
- Useful sources and further reading
Why drawings are the authoritative source for quantity measurement
Drawings convert design intent into measurable items. That is their primary function in any quantity takeoff or Bill of Quantities. A drawing tells you what is shown; the specification tells you how it should be built. You need both, but the drawing is where measurement begins.

The importance of drawings in estimation cannot be overstated: inadequate or incomplete drawings are one of the most common causes of underestimates and subsequent change orders. When a dimension is missing or a detail is ambiguous, the estimator either makes an assumption or raises a Request for Information (RFI). Either way, drawing quality directly shapes quantity accuracy.
The four fundamental measurement types that flow from drawings are:
- Linear (m): wall lengths, pipe runs, kerb lines, trims
- Area (m²): floor finishes, wall cladding, roof coverings, formwork
- Volume (m³): concrete, earthworks, fill, screeds
- Count (nr): doors, windows, light fittings, drainage gullies
NRM2 requires that quantities are measured net as fixed in position, with no allowance for waste, laps, or cutting unless the rules specifically state otherwise. That principle makes the drawing the single source of truth for the takeoff: every quantity must trace back to a visible, measurable element on a specific sheet and revision.
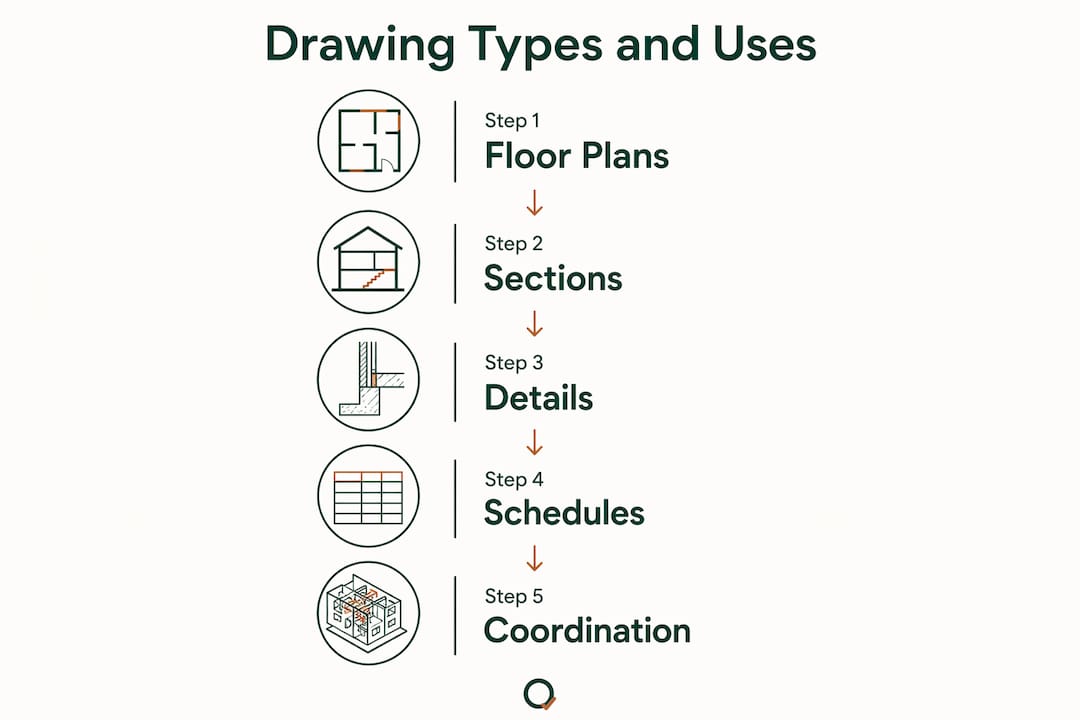
Which drawing types supply what to your takeoff
No single drawing tells the whole story. Experienced surveyors treat the drawing set as a system, building a mental picture of how the building assembles before picking up a scale rule or opening a PDF viewer.
| Drawing type | Primary measurement use | Common pitfall |
|---|---|---|
| Floor plans | Wall lengths, opening widths, room areas, setting-out dimensions | Scaled dimensions may differ from annotated ones; always use annotated figures |
| Elevations | Storey heights, external wall areas, window/door positions | Heights shown to finished floor level; confirm structural datum |
| Sections | Wall and slab thicknesses, floor-to-floor heights, composite build-ups | Sections may not match plan if drawing is at an early revision |
| Detail drawings | Junction assemblies, insulation layers, fixings, special components | Details often supersede plan notes; always check for conflicts |
| Schedules and legends | Door/window counts, finish types, fixture specifications | Schedule counts must be reconciled against plan positions |
| Site and civil drawings | Earthworks volumes, contoured areas, paved surfaces, drainage runs | Contour intervals affect volume accuracy; confirm datum and benchmark |
Floor plans are usually the starting point. Wall lengths, opening widths, and room areas all come from here. The common trap is relying on a scaled measurement when an annotated dimension is present: annotated figures take precedence.
Sections supply what plans cannot: the thickness of a cavity wall, the depth of a screed, the height of a parapet. A section drawing that conflicts with the plan is a red flag requiring an RFI, not an assumption.
Detail drawings matter most for composite assemblies: a typical external wall detail might show five or six distinct layers, each measurable separately under NRM2. Skipping the detail and measuring only from the plan will miss insulation, cavity closers, and specialist fixings.
Schedules reduce ambiguity for counted items. A door schedule lists every leaf, its size, fire rating, and ironmongery set. Counting from the plan alone risks missing doors hidden behind furniture or in phased areas.
Drawings for quantity takeoff on residential projects typically require coordinating at least four drawing types before a single BoQ item is confirmed.
UK measurement standards and drawing conventions that affect quantities
NRM2, published by the Royal Institution of Chartered Surveyors (RICS), is the current baseline for quantity measurement techniques in the UK. SMM7 remains relevant on legacy contracts and for understanding older BoQ formats, but NRM2 governs new work. Where a contract nominates a specific standard, that standard overrides everything else.
Several conventions directly affect how you read a drawing and what you measure:
- Net measurement: quantities are measured as fixed in position, with no waste or lap included unless NRM2 rules state otherwise.
- Centre-line method: used for perimeter items (e.g. strip foundations, wall plates) where measuring the centre-line of the element avoids double-counting at corners.
- Girth method: the developed length around a cross-section, used for formwork, rendering, and similar wrap-around items.
- Deductions: NRM2 specifies when openings are deducted from areas (e.g. openings over 0.5 m² in masonry) and when they are not.
A practical example: a 215 mm solid brick wall, 3.0 m high and 10.0 m long, is measured as 30.0 m² of brickwork (area), with the concrete foundation below measured separately in m³. The wall plate on top is measured in linear metres. Three items, three units, all from the same drawing, each governed by a different NRM2 rule.
How to extract quantities from drawings: a step-by-step workflow
A defensible takeoff follows a consistent sequence whether you are working on paper or in a digital PDF environment. The digital takeoff workflow recommended by practitioners runs as follows:
- Read the full set first. Review all drawings, specifications, and addenda before measuring anything. Note drawing numbers, revision letters, and any addenda that supersede earlier sheets.
- Define scope. Identify what is in and out of your package. Mark exclusions explicitly.
- Calibrate scales. On digital tools, calibrate each sheet from a known annotated dimension. On paper, confirm the stated scale and check it against a printed scale bar.
- Set up tool sets and layers. Organise measurement layers by trade and floor. Consistent colour-coding makes visual verification faster.
- Measure with markups tied to a data table. Every measurement should produce a visible markup on the drawing and a corresponding record in a data table. This is the foundation of an auditable takeoff.
- Visual verification pass. Scan each sheet for unmarked areas. A room or bay with no markup colour is a potential omission.
- Export and review. Export the data table and reconcile totals against a sanity check (e.g. typical m² per floor, devices per room).
Pro Tip: Calibrate from a structural grid dimension rather than an architectural dimension. Structural grids are set out to tight tolerances and are less likely to carry rounding errors from the design process.
For revisions, overlay the new sheet against the superseded one, identify revision clouds, and re-measure only the changed areas. Record the old quantity, the revised quantity, and the reason for the change against the drawing number and revision letter.
Common drawing interpretation errors and how to avoid them
Misreading drawings is the most common source of quantity error. The drawing set acts as the project's official language, and misinterpreting a symbol or note can cascade through an entire BoQ section.
Typical errors include:
- Missing dimensions: a wall shown without an annotated length forces the estimator to scale, which introduces error. Raise an RFI rather than assume.
- Contradictory sections: a plan shows a 100 mm partition; the section shows 150 mm. The section usually governs for thickness, but confirm with the design team.
- Double counting across drawings: measuring external wall area from both the elevation and the plan without deducting the overlap.
- Omitted items: services penetrations, movement joints, and specialist fixings often appear only on detail drawings and are missed if the estimator works only from plans.
- Misread symbols: a hatch pattern that means insulated cavity wall on one project may mean solid blockwork on another. Always read the legend.
RFI prompt template: "Drawing [number/revision] shows [description of conflict or missing information]. Please confirm [specific question] so that quantities can be measured accurately."
For junior estimators: never scale from a drawing marked "Do not scale" or "NTS" (not to scale). Never carry forward a quantity from a previous revision without checking the revision cloud. Never measure from a drawing that is not the current revision.
Tolerance and rounding also matter. NRM2 quantities are typically rounded to two decimal places for areas and volumes, and to the nearest whole number for counts. Inconsistent rounding across a large BoQ can produce cumulative errors that distort pricing.
How digital tools and BIM change the role of drawings in takeoff
Digital workflows have changed the speed and auditability of takeoffs, but they have not changed the underlying measurement principles. The dual-view principle remains central: every measurement should be a visible markup on the drawing and a linked record in a data table. That pairing is what makes a takeoff reviewable by a third party.
Benefits of digital PDF takeoffs:
- Faster linear, area, and volume measurements with snap-to-vector tools
- Symbol detection and auto-count for repetitive items (light fittings, sockets, doors)
- Version tracking and overlay tools for revision management
- Exportable data tables linked to markup IDs for audit trail
Limits to keep in mind:
- PDF accuracy depends on the drawing being vector-based and correctly scaled
- Auto-count tools can misidentify similar symbols; human validation is always required
- AI and symbol detection speed up repetitive counts but increase the need for disciplined scope definition
BIM models add a further dimension. An IFC model can supply quantities directly from object properties, but those quantities reflect the model's assumptions, not necessarily the contract drawings. Where the model and the drawing conflict, the contract drawing governs for measurement purposes. BIM is a useful cross-check, not a substitute for reading the drawings.
A practical example: a PDF takeoff of a multi-storey office floor plate, with markups colour-coded by trade and linked to a data table, caught a double count of external glazing that had been measured from both the elevation and the curtain wall schedule. The visual markup pass identified the overlap in under ten minutes. A standalone spreadsheet would not have shown it.
For guidance on reading PDF drawings in practice, the markup-to-data-table workflow is the most reliable approach currently available to UK practitioners.
How measured quantities convert to cost
A quantity takeoff and a cost estimate are not the same document. The takeoff defines scope: it converts drawings into measurable quantities. The estimate applies rates, allowances, and judgement to those quantities to produce a cost.
The conversion from quantity to cost involves several adjustments:
- Wastage allowances: materials are ordered in pack sizes, cut to fit, and subject to site waste. Typical allowances range from 5% for blockwork to 15% for ceramic tiles, depending on the pattern and cut complexity.
- Pack sizes and minimum orders: a quantity of 47 m² of flooring may require 50 m² of product once pack sizes are accounted for.
- Installation productivity: labour outputs vary with access, height, complexity of details, and sequencing. A ground-floor slab is faster to pour than a transfer deck at level 5.
- Access and temporary works: scaffold, hoisting, and propping costs are driven by the geometry shown on drawings, not just the net quantity.
Common cost drivers that trace directly back to drawing quality:
- Complexity of junctions and details (more detail drawings = more composite items = more pricing lines)
- Bespoke or non-standard elements that cannot be priced from standard rates
- Ground conditions shown on site investigation drawings affecting earthworks volumes
- Drawing quality itself: poor or incomplete drawings produce underestimates that generate change orders
Measurement feeds into pricing, which feeds into procurement schedules and tender submission. On a typical UK project, the BoQ is issued with tender documents and returned priced by contractors. Accuracy at the measurement stage directly affects the reliability of every subsequent cost document. For a practical view of how measured quantities feed cost reports, the link between takeoff and cost plan is worth reviewing before finalising any BoQ.
Construction workforce planning is also shaped by measured quantities: labour schedules, gang sizes, and programme durations all depend on accurate quantity data from the drawings.
Practical checklist for every drawing-based takeoff
Apply this checklist at the start of each takeoff to reduce errors and maintain an auditable record.
- Pre-read: confirm you have the current revision of every sheet; check the title block for drawing number, revision letter, and issue date
- Calibration: calibrate digital tools from an annotated structural dimension; record the calibration factor
- Tool-set standardisation: use consistent layer names and colour codes across all projects so markups are readable by any reviewer
- Markup linkage: every measurement produces a markup ID linked to a data table row; no orphan markups, no orphan data rows
- Revision control: when a drawing is superseded, archive the old sheet and re-measure only the changed areas; record the delta
- Peer review: have a second person scan the markup overlay for unmarked areas before exporting
Measurement reference template (paste into each markup note): Item: [description] | Basis: [NRM2 rule or convention] | Drawing: [number/revision] | Date: [date measured]
Organise output by trade and floor. A BoQ structured as "Substructure / Superstructure / Finishes / Services" by floor level is easier to check, easier to price, and easier to update when drawings are revised.
How to verify and validate quantities before finalising measurement
Verification is a distinct step from measurement. Once quantities are extracted, a structured validation pass catches errors before the BoQ is issued.
Start with an elemental sense check: compare your measured quantities against typical benchmarks for the building type. A residential flat with 85 m² of floor area should not produce 200 m² of internal wall area without a clear reason. If a figure looks wrong, it usually is.
Cross-reference totals across drawing types. The total door count from the door schedule should match the count of door symbols on the floor plans. The total external wall area from elevations should reconcile with the perimeter dimension from the floor plan multiplied by the storey height. Discrepancies flag either a drawing inconsistency or a measurement error.
Check that every NRM2 work section has been addressed. A simple coverage matrix, listing each section against the drawing that supplies it, confirms nothing has been omitted. Sections with no drawing reference are either genuinely out of scope or have been missed.
Finally, record all assumptions. Where a dimension was scaled rather than annotated, where a specification was inferred rather than stated, or where an RFI is outstanding, note it in the takeoff record. Assumptions that are not documented become disputes later.
Interpreting complex drawing elements: irregular shapes and composite assemblies
Irregular shapes require decomposition. An L-shaped floor plate is measured as two rectangles; a curved wall is measured along its centre-line arc length. The principle is to break any irregular geometry into standard shapes whose dimensions can be read directly from the drawing.
For composite assemblies, the detail drawing is the primary source. A typical external wall might comprise:
- 102.5 mm facing brickwork (measured in m²)
- 50 mm partial-fill cavity (measured in m² for the cavity closer at reveals)
- 100 mm medium-density blockwork (measured in m²)
- 60 mm rigid insulation board (measured in m²)
- 12.5 mm plasterboard and skim (measured in m²)
Each layer is a separate NRM2 item. Measuring only the overall wall thickness from the plan and applying a single composite rate misses the individual material quantities and makes the BoQ impossible to price accurately or adjust when specifications change.
Roof geometry is another common challenge. A hipped roof with varying pitches requires the plan area to be converted to the actual sloping surface area using the pitch factor for each slope. The pitch is read from the section or roof plan; the plan area from the floor plan. Neither drawing alone is sufficient.
Coordinating measurements across drawing types to prevent double counting
Double counting is the most expensive measurement error. It typically occurs at the boundary between two drawing types: external wall area measured from both the elevation and the plan, or structural steelwork counted from both the structural framing plan and the steelwork schedule.
The practical control is a measurement responsibility matrix: a simple table listing each BoQ section, the drawing type that is the primary source, and the drawing types used for cross-check only. Items measured from the cross-check drawing are not added to the total; they are used to verify the primary measurement.
For using drawings in construction measurement, the rule is: measure once from the most authoritative source, verify from a second source, and record both. Where the two sources disagree, raise an RFI before finalising the quantity.
Omissions are the mirror image of double counts. A coverage matrix that lists every drawing sheet against the BoQ sections it contributes to will show sheets that have not been measured from. Those gaps are potential omissions.
How drawing revisions are tracked and integrated into ongoing measurement
Every drawing carries a revision identifier, typically a letter (A, B, C) or number in the title block. The revision history shows what changed and when. Working from a superseded revision is one of the most common causes of quantity error on live projects.
The practical workflow for revision management:
- Maintain a drawing register listing every sheet, its current revision, and the date received
- When a new revision arrives, compare it against the superseded sheet using an overlay tool; identify the revision cloud and the scope of the change
- Re-measure only the changed areas; record the original quantity, the revised quantity, and the net change
- Update the BoQ item and note the drawing number and revision that triggered the change
On projects using a Common Data Environment (CDE) such as Autodesk Construction Cloud or Aconex, drawing issue notifications are automated. The quantity surveyor still needs to assess the measurement impact of each revision; the CDE does not do that automatically.
Where a revision changes a specification rather than a dimension, the quantity may be unchanged but the rate will differ. Note specification changes in the takeoff record even when the measured quantity is unaffected.
Drawing tolerances and their impact on quantity measurement accuracy
Construction drawings carry inherent tolerances. Architectural drawings are typically produced to ±1 mm at the drawing scale, but that tolerance translates to ±10 mm at 1:10 or ±50 mm at 1:50. For most area and volume measurements, this level of tolerance is acceptable. For precise items such as structural steelwork connections or precast panel sizes, it is not.
NRM2 quantities are measured net as fixed in position, which means the surveyor measures the design intent, not the as-built condition. Tolerances in the design drawings therefore propagate directly into the BoQ quantities. A wall shown as 10.000 m long on a 1:50 plan, measured digitally, carries a potential error of ±50 mm, or 0.5% of the dimension. Across a large floor plate with many walls, cumulative tolerance errors can affect material order quantities.
The practical response is to use annotated dimensions wherever they exist, reserve scaled measurements for items where no annotation is provided, and note in the takeoff record which dimensions were scaled. Where tolerance is commercially significant (e.g. a large earthworks volume where ±2% affects the contract sum materially), agree the measurement basis with the client or contractor before finalising the BoQ.
Key takeaways
Drawings define the net, in-place quantities that underpin every BoQ and cost estimate: measure from the drawing first, apply adjustments second, and link every quantity to a specific sheet and revision for a fully auditable record.
| Point | Details |
|---|---|
| Drawings define net quantities | Measure lengths, areas, volumes, and counts from drawings before applying waste, rates, or productivity factors. |
| NRM2 governs UK measurement | Follow NRM2 unit rules and conventions (centre-line, girth, net); record the nominated standard on every takeoff. |
| Markup linkage is the audit control | Link every measurement to a visible markup and a data table row so any reviewer can trace quantities to a specific drawing revision. |
| Revisions require structured management | Maintain a drawing register, overlay new revisions, re-measure only changed areas, and record the delta against the drawing number. |
| Quantiflow automates NRM2-aligned takeoffs | Quantiflow turns PDF drawings into structured, auditable BoQ output from £39/month, preserving the surveyor's professional judgement throughout. |
Why professional judgement still defines the quality of a takeoff
There is a tendency in discussions about digital takeoff tools to treat speed as the primary metric of quality. It is not. The most consequential skill in quantity measurement is the ability to read a drawing set as a system: to notice when a section contradicts a plan, when a detail supersedes a note, when a schedule count does not match the symbol count on the floor plan.
The professional judgement of a quantity surveyor is what catches those contradictions before they become priced errors. Automation handles repetitive counting reliably. It does not handle ambiguity, and ambiguity is where the money is.
My own habit when starting a new drawing set is to read the sections and details before the plans. Plans show extent; sections and details show complexity. A project with simple plans but intricate details will almost always produce more BoQ items than the plan suggests, and those items carry the highest unit rates. Missing them at takeoff stage is not a scaling error; it is a scope error, and scope errors do not get corrected by better software.
The 'eyeball verification' pass, scanning each marked-up sheet for areas with no markup colour, takes five minutes on a typical floor plate and catches omissions that a data-table review would never surface. It is the single habit I would recommend to any surveyor moving from paper to digital workflows.
Peer review matters too. A second pair of eyes on the markup overlay, even for ten minutes, consistently finds things the measurer missed. Build it into the programme, not as an optional extra but as a standard step before any BoQ is issued.
Quantiflow brings NRM2-aligned automation to UK takeoffs
Producing an auditable, NRM2-compliant BoQ from a dense PDF drawing set takes time that most SME quantity surveyors and builders do not have in abundance. Quantiflow cuts that time significantly by automating the measurement and structuring the output into a priceable BoQ, while keeping the surveyor in control of scope definition and professional judgement.

Every takeoff Quantiflow produces is traceable: markups link to data table rows, drawing numbers and revisions are recorded, and the output is structured to NRM2 work sections. The surveyor reviews, adjusts, and signs off. The automation handles the repetitive extraction; the professional handles the interpretation. Plans start from £39/month for solo practitioners, with Business (£149/month) and Enterprise tiers for larger teams.
Measured twice. Priced once. See how Quantiflow works and request a demo for your next project.
Useful sources and further reading
- NRM2 (RICS New Rules of Measurement, Part 2): the current UK standard for detailed measurement of building works. Available from the RICS bookshop; essential reading for any practising QS.
- SMM7 (Standard Method of Measurement, 7th edition): the predecessor to NRM2, still referenced on legacy contracts. Background at Designing Buildings.
- Bluebeam digital takeoff guides: practical guidance on defensible takeoff steps and construction takeoff workflows, including calibration, markup linkage, and revision management.
- Designing Buildings wiki: accessible explanations of UK construction drawing conventions, measurement methods, and contract documentation.
- CIOB (Chartered Institute of Building): ciob.org publishes guidance on construction management practice, including measurement and documentation standards.
- BIM Outsourcing: what construction drawings are in the UK and how to read them for contractor and consultant use.
Always record drawing numbers and revision letters in your takeoff, and consult the contract's nominated measurement standard where any conflict arises between NRM2 conventions and project-specific instructions.