
OCR for drawings works, but only when you stop treating a technical drawing as a document and start treating it as a scene. The pipeline that succeeds in production runs region localisation first, feeds each region to a specialised recogniser, then corroborates the output with rule-based post-processing. Skip the localisation step and drop a title block, a schedule, and a dimension string into a generic OCR engine, and you'll get a confident, wrong answer.
Two checks tell you fast whether your data suits this approach. Pull one title block and see if a generic engine reads the drawing number correctly. Then try a schedule table and check whether rows and columns survive as structured data rather than a wall of unordered text. Quantiflow, which builds NRM2-aligned takeoff software for UK quantity surveyors, has seen both failure modes repeatedly when cross-referencing architectural drawings at scale.
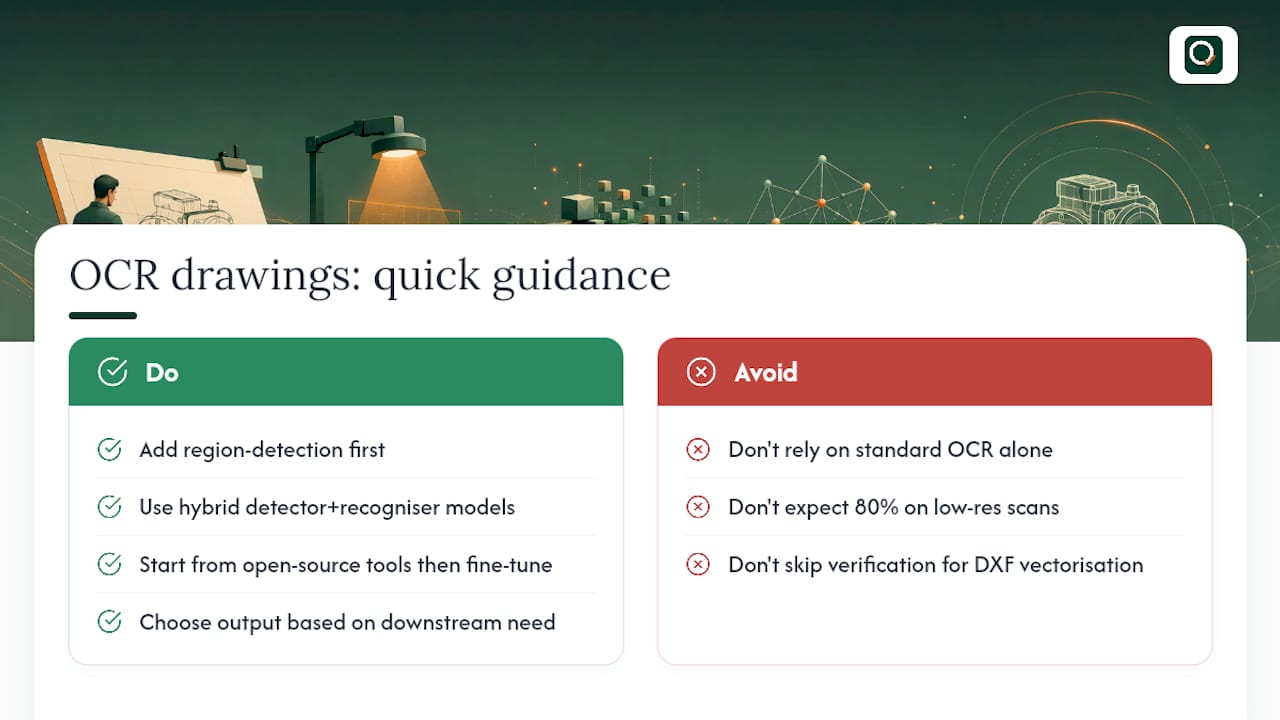
- Verdict: region detection → specialised recogniser → post-processing validation, not raw OCR
- First test: run a title block through your candidate engine and check field accuracy
- Second test: run a door or window schedule and check column integrity, not just text presence
- Expect: touch-up on every batch, however good the model
Key Takeaways
Reliable OCR for drawings depends on localising regions before recognition, corroborating results with domain rules, and keeping a human review gate on anything priced.
| Point | Details |
|---|---|
| Localise before recognising | Detect title blocks, schedules, and text clusters as regions before running any recogniser. |
| Expect touch-up always | Automated conversion reduces manual correction but never removes it entirely, whatever the accuracy claim. |
| Hybrid models win on symbols | Detector-plus-recogniser approaches reached around 80% precision and recall on GD&T test sets, well ahead of text-only tools. |
| Synthetic data closes the gap | Generated training drawings with varied fonts and rotations improve detection when real labelled data is scarce. |
| Quantiflow handles the takeoff step | Quantiflow pairs extraction-style cross-referencing with a live UK rate library, turning drawing data into a priceable BoQ. |
Table of Contents
- Why engineering drawings break standard OCR
- Canonical pipeline: region localisation, recognition, corroboration
- Choosing between classical OCR, hybrid models, and end-to-end AI
- Building the training data your models actually need
- An implementation checklist for developers
- Measuring whether your pipeline is production ready
- Where OCR output actually goes: takeoff, CAD, and searchable archives
- What the research still doesn't tell you
- Getting from OCR text to a priced takeoff with Quantiflow
- Frequently asked questions
- Sources
Why engineering drawings break standard OCR
Standard OCR engines are trained on prose: dense paragraphs, consistent orientation, high contrast between ink and page. Engineering drawings offer almost none of that. Text sits sparse and scattered across a canvas dominated by lines, hatching, and dimension arrows, and detectors trained on documents frequently mistake a dimension line for a text baseline or miss a rotated label entirely.
Three specific issues cause most of the damage:
- Overlapping graphics. Leader lines, hatching, and grid stamps cross directly through characters, breaking the character segmentation most OCR engines rely on.
- Sparse and rotated text. Vertical dimension labels, angled section callouts, and single-character tags give a recogniser almost no context to disambiguate similar glyphs, and standard models trained on horizontal prose fail badly here.
- Non-standard symbols and GD&T. Geometric dimensioning and tolerancing marks, weld symbols, and revision triangles aren't characters at all, and a text-only recogniser either ignores them or hallucinates a nearby letter.
Vector-origin PDFs behave differently from scanned raster files. A CAD-exported PDF retains searchable text layers and precise line geometry, so localisation can lean on that structure directly. A raster scan of a printed sheet has none of that, meaning every element, text included, must be inferred from pixels. Research on technical drawing digitisation confirms that models trained on general documents underperform specifically because they've never seen this combination of sparse abstract text and dense graphical noise.
Canonical pipeline: region localisation, recognition, corroboration
Start with acquisition. Raster scans need at least 300 DPI to keep small dimension text legible; vector PDFs should stay in their native format for as long as possible rather than being flattened to an image early, since flattening throws away the exact text layer you'd otherwise get for free.
Region localisation comes next. Object detectors such as YOLO or Faster R-CNN, trained to spot title blocks, schedule tables, and text clusters as bounding boxes, consistently outperform naive whole-page OCR because they isolate text from the surrounding graphics before recognition even starts. Heuristic clustering (grouping OCR word detections by proximity and orientation) works as a lighter-weight alternative when you lack labelled training data for a full detector.
Recognition follows, region by region:
- CRNN with CTC decoding handles horizontal and near-horizontal text lines well once cropped from surrounding noise.
- Keras-OCR offers a workable open-source starting point for prototyping this stage without building a recogniser from scratch.
- Cloud OCR services act as a useful fallback for regions your primary recogniser scores low confidence on, provided your data-handling policy allows it.
Post-processing is where drawings get corroborated rather than just read. Spatial corroboration cross-checks a detected label against its expected position relative to a title block or schedule grid. Regex patterns catch malformed dimension strings. Table parsers turn schedule rows into structured fields, and every extracted value should carry a confidence score before it reaches a human reviewer.
Pro Tip: Run the recogniser twice, once on the original crop and once on a rotated version, and let the higher-confidence result win. Rotated dimension text is one of the most common silent failure points.
Choosing between classical OCR, hybrid models, and end-to-end AI
Your data volume, accuracy target, and privacy constraints should decide the architecture, not whichever tool is trending.
- Classical engines (Tesseract and similar) suit clean, horizontal, high-contrast text such as revision tables or notes blocks, and cost almost nothing to deploy.
- Detector plus recogniser hybrids win on anything with sparse or rotated text, because localisation strips out graphical noise before recognition even attempts a read. A YOLOv5 and Vision OCR hybrid reported precision and recall around 80% on GD&T recognition test sets, a meaningful jump over text-only approaches on the same symbol classes.
- End-to-end deep learning recognisers can outperform both when you have enough domain-specific training data, but they demand more compute and more labelled examples to reach production accuracy.
Fallback chains matter as much as the primary model. Route low-confidence regions to a secondary recogniser or a cloud service, and decide upfront whether local processing is mandatory for confidentiality before you build cloud dependency into the chain. Throughput and privacy pull in opposite directions here, so pick deliberately rather than defaulting to whichever API is easiest to wire up first.
Building the training data your models actually need
Real labelled engineering drawings are scarce, and manually annotating thousands of them isn't realistic for most teams. Synthetic data generation fills the gap: procedurally generated drawings with controlled variation in fonts, rotation, occlusion, and symbol placement give a detector far more diversity than a small real dataset ever could.
Annotation strategy should cover distinct region classes, not just "text" as one blob:
- Title block
- Schedule or table
- Text line (with rotation angle recorded)
- Symbol or GD&T mark
Research on brownfield drawing digitisation found that artificially generated training images improved detection quality enough to outperform off-the-shelf models trained only on general documents, a substantial argument for investing in a generator before you invest in more labelling hours.
The practical recipe: pretrain on a large synthetic corpus, then fine-tune on your smaller set of real, labelled drawings. This transfer-learning approach routinely beats training end-to-end on the small real dataset alone, since the synthetic pretraining teaches the model what technical drawings generally look like before it specialises on your specific sheet conventions.
An implementation checklist for developers
Work through this in order rather than jumping straight to model selection:
- Capture at the right fidelity. Scan raster sheets at 300 DPI minimum; preserve the text layer whenever a vector PDF is available rather than rasterising it.
- Score region candidates. Use position heuristics (title blocks cluster bottom-right or along a right-hand strip on most UK drawings) alongside your detector's raw bounding boxes.
- Detect table structure explicitly. Cluster OCR word detections into rows by their vertical centre point, then find columns by looking for left-edge gaps that repeat across at least 30% of rows, a method the open-source BlueprintParser engine uses to avoid false column splits in noisy schedule tables.
- Map short tags with edit distance. For codes and abbreviated tags, allow a small edit-distance tolerance when matching against a known symbol or schedule vocabulary rather than demanding exact string matches.
- Export to structured formats. CSV for tabular schedule data, DXF where geometry needs to travel with the extraction, never a flat text dump.
- Gate everything through human review. Route anything below your confidence threshold to a reviewer before it reaches downstream costing or CAD work.
Pro Tip: Build your OCR-to-detector mapping as a separate, versioned lookup table rather than hardcoding it into the recogniser. Drawing standards change between projects and firms, and you'll thank yourself later.
Measuring whether your pipeline is production ready
Three metric families matter, and each maps to a different pipeline stage. Mean average precision (mAP) tells you whether your region detector is finding title blocks and tables reliably. Character and word error rates tell you whether the recogniser reads correctly once a region is isolated. Precision and recall on table extraction tell you whether structured data survives the schedule-parsing step intact.
- Overlapping lines through characters remain the single most common recognition failure.
- Rotated or vertical dimension text is the second most common, particularly on sectioned views.
- Symbol misreads (a GD&T mark read as a stray letter) tend to cluster on older, lower-resolution scans.
Pilot on a bounded batch with full human verification before scaling, and only widen automation once the cost of an occasional extraction error is genuinely acceptable for the workflow it feeds.
Where OCR output actually goes: takeoff, CAD, and searchable archives
Extracted text rarely stays as text. It feeds spatial taggers that pin labels to coordinates, CSI-style project graphs that organise elements by trade, and takeoff engines that turn a recognised quantity into a priced line item. BlueprintParser's own pipeline demonstrates this chain directly: rasterise, recognise, detect spatially, then tag by CSI code.
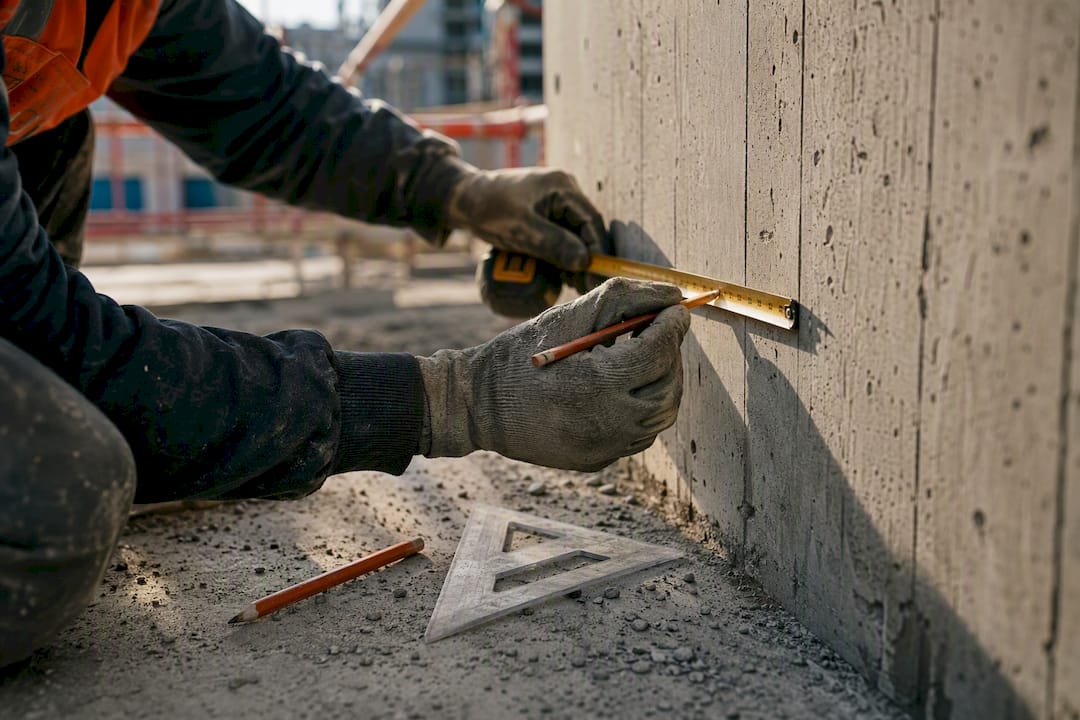
Deciding how far to push conversion matters. Stopping at searchable OCR text suits archiving and keyword search; pushing on to full DXF vectorisation suits anyone who needs to edit geometry in CAD. Digitisation guidance consistently frames this as levels of digitisation, and automated conversion reduces manual touch-up without eliminating it at any level. Anything feeding a bill of quantities needs a human-in-loop checkpoint before the number reaches a client, whatever the OCR confidence score claims.
What the research still doesn't tell you
Most published benchmarks test detection and recognition in isolation, rarely the full chain from raw scan to priced quantity.
Ask any vendor for their benchmark dataset and validation method before trusting a headline accuracy figure, not after. The gap between a curated academic dataset and your actual drawing archive is usually where the real accuracy number lives, and that gap rarely shows up in a press release. This is precisely why preserving professional judgement at the review stage matters more than chasing another percentage point of model accuracy.
Getting from OCR text to a priced takeoff with Quantiflow
Running your own OCR pipeline gets you structured text and numbers off a drawing. Turning that into a priced, NRM2-aligned bill of quantities is a separate job, one Quantiflow was built specifically to close. It combines OCR-style extraction with spatial corroboration across sheets, cross-referencing schedules against plan views automatically rather than leaving that check to a spreadsheet.
Quantiflow keeps a live UK rate library attached to every extracted quantity, so the output arrives priceable, not just readable, and every extraction stays open to override because the quantity surveyor's judgement makes the final call, not the model. Pricing runs from Solo at £39 a month for sole practitioners, through to Business at £149 a month for teams, with Enterprise available for larger firms. If your team is evaluating whether to build an in-house OCR pipeline or buy one that already handles the takeoff step, visit the Quantiflow product page and start a trial against one of your own drawing sets.
Frequently asked questions
Can standard OCR read engineering drawings accurately? Not reliably. Standard OCR is trained on prose layouts, and it struggles once text overlaps graphics, appears rotated, or sits alongside symbols it's never seen. A region-detection step before recognition fixes most of this.
What accuracy can I expect from OCR for drawings? It depends heavily on scan quality and symbol complexity, but hybrid detector-plus-recogniser models have reported precision and recall around 80% on GD&T recognition test sets. Expect lower results on older, low-resolution scans.
Do I need machine learning expertise to build this, or can I use existing tools? Open-source starting points such as Keras-OCR and BlueprintParser give you a working baseline without training a model from scratch, though domain-specific fine-tuning still improves results meaningfully over the out-of-the-box versions.
Should I aim for searchable text or full CAD vectorisation? That depends on the downstream use. Searchable text suits archiving and keyword lookup; full DXF vectorisation suits anyone who needs to edit the geometry directly in CAD, and it costs considerably more in tooling and verification to reach.
How does this connect to quantity takeoff software? OCR extraction gives you raw text and numbers off a drawing; a takeoff platform like Quantiflow then cross-references that data against a live rate library to produce a priced, NRM2-aligned bill of quantities, with the quantity surveyor retaining final sign-off.
Sources
- Text detection on technical drawings for the digitization of brown-field processes
- BlueprintParser_OS — AI blueprint parsing engine (GitHub)
- Implementation of YOLOv5 and Vision OCR hybrid model for GD&T recognition (ISCI 2024)
- Digitizing paper drawings and PDFs: how to convert to DXF/CAD and where AI actually helps (Timewell)