
Live construction rates are near real-time material, labour, and equipment prices pulled from supplier feeds, dashboards, or vendor databases rather than a printed cost book. The immediate payoff for estimators is straightforward: bids built on current pricing, not on a quarterly index like ENR's or the government's Bureau of Labor Statistics figures from three months ago, hold up better against margin erosion and client challenge.
TL;DR:
- Live construction rates from supplier feeds offer more accurate bid pricing than cost indexes, especially during commodity spikes that indexes may lag.
- Cost books exclude soft costs, site logistics, regional wage differences, and project-specific overhead, making live rates necessary for precise short-term bidding.
- Verifying live data requires transparency about sourcing, methodology, regional coverage, and alignment with broader market trends to avoid stale or unreliable figures.
- Integrating live rates into workflows with proper version control, source logging, and contingency planning ensures credible, defendable bids and effective change management.
- Using live rates for early procurement decisions and linking them to construction management software can improve budgeting accuracy and schedule agility during volatile market conditions.
Table of Contents
- How live rates differ from cost indexes and cost books
- Where to find reliable live construction rates
- Building live rates into your estimating workflow
- Verifying live-rate quality: confidence signals and red flags
- Limitations and common pitfalls
- Combining automated takeoffs with live rates
- How live rates change budgeting and scheduling
- Connecting live rates to construction management software
- Case studies: live rates in real project scenarios
- Should your firm pay for live-rate subscriptions?
- Sources
How live rates differ from cost indexes and cost books
A cost index tells you where prices have been. A live rate tells you where they are right now, and that difference decides whether your bid survives contact with a supplier's actual invoice.
Published indices from ENR, Turner, and Mortenson typically lag the market by three to six months, according to RLB's Q2 2026 construction cost report. RLB's own tracking shows the national construction cost index climbing to 288.58 in Q2 2026, a useful marker of direction but a poor guide to what copper or PVC costs this week. That gap matters most when a commodity spikes between index updates, which happens more often than most cost books admit.
Cost books carry a second limitation that catches out newer estimators: they usually price the material and the labour, and stop there.
- General conditions, site logistics, and project-specific overhead rarely appear in a standard cost book line item.
- Soft costs, including permitting, design fees, and insurance, sit outside almost every published rate table.
- Regional wage variance gets flattened into a national or regional average that may not reflect your county.
The practical rule is simple: use a published index as your baseline for long-range budgeting and trend context, and reserve live, supplier-sourced rates for the number you actually put in front of a client. RLB's own guidance backs this split, noting indices work for trend context but not short-term bidding. Treat the index as the weather forecast and the live rate as the reading off your own thermometer.
Where to find reliable live construction rates
Not every dashboard deserves a bookmark. The ones worth your subscription fee fall into four distinct categories, each with a different strength.
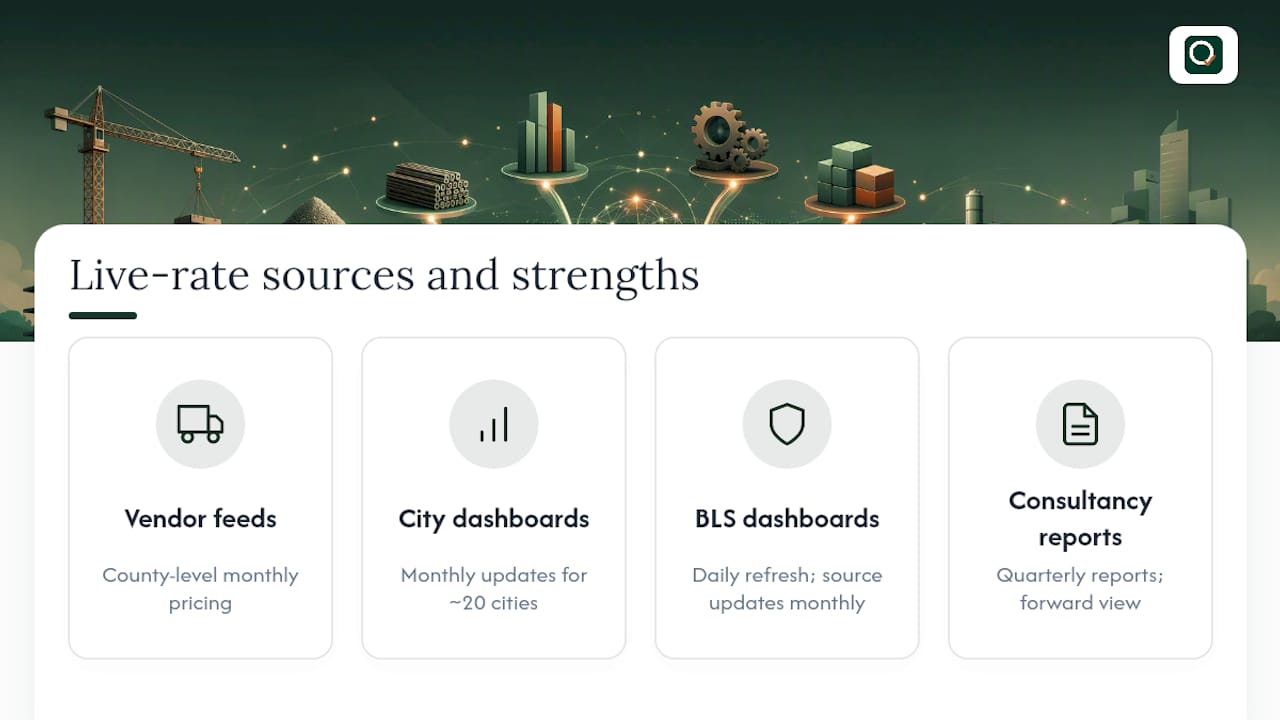
Supplier-sourced vendor databases pull pricing directly from suppliers and local building-material merchants, which gives them the tightest geographic granularity. Projul, for example, updates its construction cost data monthly at county level, sourcing figures straight from the vendors selling the material. That's the kind of data you want feeding a bid for a specific job in a specific ZIP code, not a national average dressed up as local pricing.
The ENR Construction Cost Data Dashboard takes a different approach: monthly, human-verified updates across roughly 20 major cities, covering thousands of materials, labour, and equipment items. It's less granular than a county-level vendor feed but far more useful for comparing markets or sanity-checking a rate that looks unusually high or low.
SkillSignal and other BLS-driven dashboards refresh automatically from government releases, tracking 82 official cost indicators pulled directly from the Bureau of Labor Statistics. These update daily, which sounds impressive until you realise the underlying government data itself only moves monthly. What you're really getting is a fast, reliable confirmation signal rather than fresh local pricing. Use it to check whether a spike you're seeing in a supplier feed matches a genuine national trend or is a one-off blip.
Consultancy reports and indices, including those from RLB, Mortenson, and Turner, add something none of the live dashboards offer on their own: professional interpretation. These firms read tender activity, labour markets, and material futures and publish a forward view, not just a snapshot. RLB's Q2 2026 report is a good example of a document that tells you not just what happened last quarter but what to watch next.
Between these four sources, most SME estimators end up running one supplier-sourced feed for county-level material pricing, one dashboard for city comparisons, and a quarterly consultancy report for context. Anything beyond that starts to cost more in subscription time than it saves in accuracy.
Building live rates into your estimating workflow
Getting live data into a dashboard is easy. Getting it into a defensible, auditable bid takes a workflow, not a browser tab.
- Subscribe or collect. Pick your primary supplier-sourced feed and your confirmation dashboard, then set a fixed day each week or month to pull fresh figures rather than grabbing them ad hoc.
- Map to your Bill of Quantities line items. Every rate needs a home in your BoQ structure. Generic "material cost" line items make it hard to spot when a single trade has moved.
- Set a refresh cadence and version control it. Decide whether your assemblies refresh weekly or monthly, then log the date and source against every rate you apply. If a client or subcontractor challenges a number six weeks later, you need to show exactly where it came from.
- Apply contingency and escalation appropriately. Live rates reduce guesswork, but they don't remove volatility. Build a tiered contingency, higher on trades showing recent price swings, lower on stable commodity lines.
- Separate hard costs from soft costs before you total the bid. Live feeds almost universally price materials, labour, and equipment. Permitting, general conditions, and overhead need their own line items, priced from your own historical data or firm-specific rates, as our guide to cost engineering in construction covers in more depth.
Pro Tip: Log the source and date on every rate you import into an estimate, not just the figure itself. When a bid comes under scrutiny months later, being able to show "framing lumber, sourced from [vendor], pulled 14 March" turns a defensive conversation into a five-minute explanation.
Automation earns its keep here. Rather than re-keying rates into a spreadsheet every cycle, export live pricing from your dashboard or vendor feed and import it directly into your assemblies. Version control matters more than people expect: an estimate built on 12 March pricing and revised on 2 April with no record of which rates changed is a liability the moment a client asks why the number moved. Our guide to construction cost benchmarking methods walks through how to layer external indices against your own historical benchmarks for exactly this reason.
Verifying live-rate quality: confidence signals and red flags
Not all "live" data is equally trustworthy, and the difference usually comes down to how transparent the source is about where its numbers originate.
Look for these confidence signals before you build a bid on a feed:
- Supplier-sourced pricing, where the vendor states the data comes directly from suppliers or merchants rather than a modelled estimate.
- Methodology disclosure, meaning the provider explains how prices are collected, sampled, and verified.
- Sample size and regional coverage, since a feed drawing from three suppliers in a county tells you less than one drawing from thirty.
- Alignment with broader index trends, checking that a live rate's direction roughly matches what ENR or BLS-derived dashboards are showing nationally.
One of the sharpest leading indicators sits outside any dashboard entirely: tender and procurement activity. Subcontractor bid behaviour tends to move before published indices catch up, since bidders adjust pricing the moment they feel supply pressure on a trade. RLB's own analysis treats rising or falling tender activity as an early signal of price volatility, often weeks ahead of any index update. If you're seeing unusually aggressive or unusually thin bids on a specific trade, that's worth investigating before you commit a rate to your BoQ.
Red flags run the other direction. Be wary of a feed that won't explain its sourcing, that shows suspiciously smooth pricing with none of the volatility everyone else is reporting, or that draws from a single dominant supplier without disclosing it. A rate that never moves is not a stable market; it's usually a stale one.
Limitations and common pitfalls
Live rate feeds price hard costs well. They tend to fall short everywhere else.
Soft costs, permitting fees, general conditions, and overhead and profit almost never appear in a supplier feed, which means every estimate still needs a separate line for them, built from your own firm's data rather than a dashboard. Regional coverage also varies more than most estimators assume: a feed strong in the Southeast may have thin supplier representation in the Mountain West, and that gap can quietly bias a rate toward whichever region has the most active vendors reporting.
The most common mistake is overreacting to a single week's spike. A tiered contingency approach handles this better than panic:
- Treat a one-off spike as noise until it holds for two consecutive updates.
- Confirm any unusual move against a second source before adjusting a bid.
- Call your regular supplier directly when a live rate looks out of step with what you're used to paying.
Combining automated takeoffs with live rates
Live pricing only helps if it lands on an accurate quantity. Feed a correct rate against a wrong takeoff and you've built a precise number that's still wrong.
This is where automated quantity takeoff tools change the maths. A platform like Quantiflow extracts measured quantities directly from architectural drawings and cross-references them against an NRM2-aligned Bill of Quantities structure, cutting the manual measurement errors that live rates alone can't fix. The professional judgement stays with the estimator: the software surfaces the quantities, the surveyor decides what they mean for the bid.
In practice, pairing automated takeoffs with live-rate feeds tends to produce a few consistent outcomes:
- Faster estimate cycles, since quantities don't need re-measuring by hand for every revision.
- Fewer reworks when a drawing changes, because the takeoff updates rather than requiring a full remeasure.
- A clearer audit trail, showing exactly which quantity and which rate produced each line item.
Live rates handle the pricing side of a bid. Automated takeoffs handle the quantity side. Neither replaces the estimator's judgement on either.
How live rates change budgeting and scheduling
A budget built on stale pricing doesn't just risk being wrong. It risks being wrong in a direction that only shows up after the contract's signed.
When material costs move faster than a quarterly index can track, projects priced six months before groundbreaking often carry contingencies calculated against outdated assumptions. Live rates narrow that gap by letting estimators reprice key assemblies closer to the actual procurement date, rather than relying on figures set at initial budget approval. That has a direct effect on scheduling too: when a live feed flags a trade heading into a price spike, procurement teams can pull that package forward, locking in pricing before the increase fully lands, an approach Gordian's Q3 2026 construction cost insights specifically recommend through early trade packaging.
The scheduling knock-on works both ways. A material showing a live-rate increase might justify accelerating that procurement package, while a trade showing softening prices might tolerate a delay without budget risk. Static cost books can't offer that kind of tactical timing because they don't move fast enough to catch the window. Budgets built on live data end up doing double duty: they price the job accurately today, and they tell the scheduling team where the next few weeks of price risk are concentrated.
Connecting live rates to construction management software
A live rate sitting in a browser tab does nothing for a project team unless it reaches the software actually running the job.
Most construction management platforms now support some form of rate import, whether through a direct feed, an API connection, or a manual export and upload cycle. The mechanics matter less than the discipline behind them: whichever method you use, every imported rate needs a timestamp and a source attached, so anyone reviewing the budget later can see exactly when a figure was pulled and where it came from. That single habit, logging the source alongside the number, is what turns a live-rate subscription into a genuine audit trail rather than a moving target nobody can explain.
Where this pays off most is change order management. When a client requests a scope change mid-project, an estimator working from a system with live rates already mapped to assemblies can reprice that change in minutes rather than re-running comparisons across three sources. The same logic extends to multi-project firms managing several bids simultaneously: centralising live rates in one system, rather than scattering them across spreadsheets and dashboard screenshots, keeps every active estimate working from the same current baseline instead of whatever pricing happened to be open when each estimator last checked.

Case studies: live rates in real project scenarios
Consider a mid-size commercial contractor bidding a retail fit-out where copper and electrical conduit pricing had been volatile for two consecutive quarters. A bid built purely from a cost book six months old would have underpriced the electrical package by a margin most firms can't absorb. Pulling current supplier-sourced rates at the tender stage, then confirming the trend against a BLS-driven dashboard, gave the estimator confidence to price the electrical trade at current market rather than historical average, protecting margin on a package that would otherwise have been a loss leader.
A second, quieter example plays out constantly in residential and light commercial framing. Lumber pricing swings sharply enough, and often enough, that a framing package priced from a quarterly index alone regularly lands 10 to 15 percent off actual procurement cost by the time material gets ordered. Firms that check a supplier-sourced feed at the point of ordering, rather than relying solely on the number from the original bid, catch that drift before it becomes a change order dispute with the client.
The common thread in both cases isn't the tool used. It's the habit of checking price at the moment of decision rather than trusting a number set weeks or months earlier.
Should your firm pay for live-rate subscriptions?
High-volume estimators bidding repeat work in the same region get the clearest return from a paid subscription; the cost per bid drops fast once you're pricing the same trades monthly. If that's not you, pilot first: pick one trade, like framing, run live-rate assemblies against three recent bids, and measure the variance before committing. Firms with strong, current supplier relationships may find a phone call still beats a dashboard.
— Michael
Sources
- RLB — Construction cost report, Q2 2026
- Gordian — Construction cost insights, Q3 2026
- ENR — Construction Cost Data Dashboard
- SkillSignal — Construction cost dashboard
- Projul — Live construction cost data by county